A search engine for scholarship returns a list of papers, and the reading is left to the scientist. In the fifth essay we described a different object: a research field compiled into a living database. Each paper is audited into an Evidence Capsule that keeps the conditions its claim depends on, and the same five moves of the Big Five ladder run one level higher across all the capsules of a topic. This essay is about what a scientist can ask of it.
Our aim is a scholarly search engine for the age of AI. A scientist asks a question. The system answers with something in the form of a paper: the question, the capsules and open datasets it drew on, the analyses it ran, the result, and what limits the result. The answer is recorded. Other scientists read it, challenge it and rank it, and the next question starts from a richer record. We expect a system like this to surface ideas that no single paper states, and to do it in a form a person can follow.
Getting there takes three design rules, and each one applies a move from the ladder of the fourth essay to the system's own output. An answer must report a declared family of defensible analyses as one object. Answers must sit on a different shelf from evidence. And the top rung must be used for what it is, a way of eliminating explanations, so that what it hands the scientist is the part of the record that nothing yet explains, together with the experiment that would settle it. Everything below describes the design we are building.
Knowledge that nobody has read together
In 1986 Don Swanson, an information scientist at the University of Chicago, noticed that two bodies of medical literature never met. Twenty-five articles gave evidence that dietary fish oil lowers blood viscosity, inhibits platelet aggregation and makes red blood cells more deformable. Thirty-four articles on Raynaud's syndrome gave evidence that those same blood factors are abnormal in at least some patients. The two sets had no articles or authors in common and did not cite each other [1]. So the idea that fish oil might help Raynaud patients sat in public print in two halves, with no reader holding both.
Two years after Swanson published the argument, a randomized placebo-controlled trial in 32 patients reported that fish oil delayed the onset of induced attacks [1]. The abstract of the full report gives the benefit in primary Raynaud's, where 5 of 11 patients on fish oil could no longer have an attack induced, against 1 of 9 on olive oil, and reports none in secondary Raynaud's [2]. Swanson drew the general lesson himself: science responds to its own growth by specialising, and it tends to neglect connections [1].
Today software can look across far larger gaps. Tshitoyan and colleagues trained word vectors on about 3.3 million abstracts of materials science papers and ranked materials by their similarity to the word "thermoelectric". When they rebuilt the model from abstracts published before 2009 only, three of its top five candidates were later reported or suggested as thermoelectrics [3]. Such a ranking directs attention, and it leaves the scientist to reconstruct why a candidate deserves months at the bench. Swanson's own method had the opposite character. He called it neither a recipe nor an algorithm, because it depended at every step on the knowledge of the person searching [1]. The engine we describe is meant to keep his reasons and to work at the software's scale.
Rule one: an answer is a whole family of analyses, shown together
The tempting version of this engine runs every statistical, bioinformatic and data-science method it has on a question, and writes up whatever comes out significant. That version would be a machine for false discoveries. Ioannidis showed why with a simple model. Among findings that reach statistical significance, the share that are true falls as fewer of the tested hypotheses are true to begin with, as bias in the design and analysis grows, and as more teams test the same question; and he argued that flexible designs and analyses raise that bias [4]. In omics data the choices multiply quickly: the normalisation, the covariates, the batch correction, the test itself. In simulations with no true effect and a 5% threshold, reporting the best of ten unrelated outcomes gave about 40% false positives, and choosing among twelve rules for removing outliers gave almost 30% [5]. Those simulations model a person who tries a few variants by hand. An engine can try thousands.
The third rung of the ladder, Stabilization, is the rule that a whole family of tests must be handled as one object. Applied to the engine's own work, it changes what an answer is. The answer is not the best result. It is the spread of results over a declared family of defensible analyses, grouped by the quantity each one estimates and shown together, with a joint test where one is justified. The scope of the family is recorded with the answer. Statisticians already have names for this. In a multiverse analysis, every defensible way of processing the data is run, and all the results are reported. In its first demonstration, a published result with p = 0.012 became 120 analyses, of which 7 were significant [6]. A specification curve plots the estimates from all reasonable specifications and tests them jointly against the same analyses run on reshuffled data. In one of its examples, 37 of 1,728 specifications were significant, but the joint test gave p = 0.85. In another, 85 of 90 were significant, with a joint p below 0.002 [7].
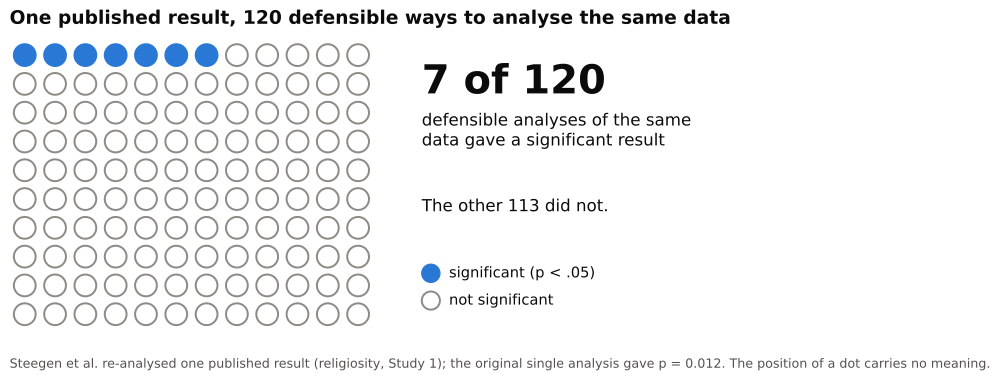
Filled circles are significant at p < .05 and hollow circles are not. Source: reference [6].
So an answer from the engine might read: of the analysis paths that the rules allow, most give an effect in the same direction, and every path that does not is one that left cell composition unadjusted. A scientist learns more from that sentence than from one p-value, and it is a kind of result that a paper rarely has room for.
Rule two: answers and evidence sit on different shelves
The second temptation is to file each answer back into the database as one more paper, so that the collection grows by feeding on itself. The trouble is that evidence would then begin to cite itself. In the fifth essay we met the human version of this: around one claim, 94% of the 214 citations to the papers that had tested it went to the four papers that supported it, and a hypothesis became a fact through citation alone [8]. A system that counted its own answers as evidence would do the same thing at machine speed.
Machine learning has a related result. When a language model was fine-tuned, generation after generation, on text produced by the generation before, it lost the rare cases in the tails of the original data first. Keeping a tenth of the original data in every round left only minor degradation [9]. That finding is about training models, not about a database, and we take it as a warning by analogy. The rare and awkward observation is where a discovery usually starts, and a record that feeds on its own summaries smooths such observations away. That result is a reason to preserve the original observations. Our database adds a rule of provenance: a derived answer stays distinguishable from the evidence it used.
The fourth rung, Stratification, keeps levels of evidence apart, and here it gives the database two shelves. The first shelf holds observations: capsules of audited papers and data. The second holds derived work: the engine's answers, each bound to the versions of the capsules it used. A derived answer can be read, cited, challenged, ranked and recombined with others. It can inform another analysis through its recorded dependencies, but it never counts as additional independent evidence. An answer moves to the first shelf in only one way: someone tests it, and the result of that experiment or new study enters as a capsule, audited like any other. So the system does grow with every use, but its evidence grows only when the world is consulted.
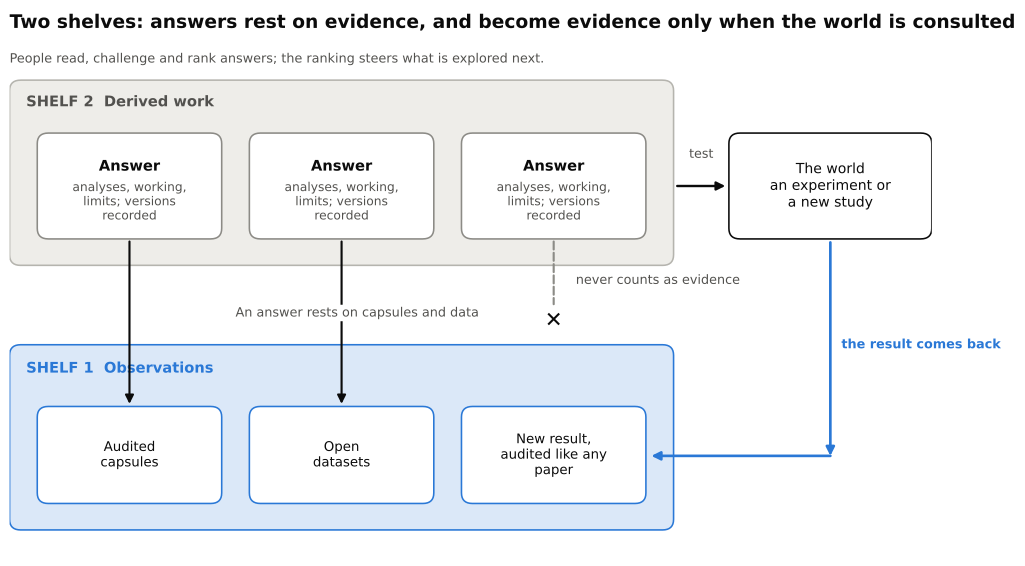
Answers sit on the upper shelf and cite the lower one. An answer becomes evidence only through a test, whose result returns to the lower shelf as an audited capsule.
Rule three: the fifth rung eliminates, and what remains is the finding
In the fourth essay we read the top rung of the ladder, , as a move we called Self-Reflection. In the mathematics, that system allows impredicative comprehension: it forms a set by a condition that quantifies over all the sets of a kind, the new set included. Our reading, as there, is an analogy. In science, a causal claim has to hold against the competing explanations of the same observation, so testing it means surveying the space of competitors and not following one path.
The rung does not invent an explanation. It removes the ones the record contradicts. A compiled topic holds, for every candidate explanation, the capsules that support it, the capsules that contradict it, and the conditions under which each did so: the species, the sex, the exposure window, the assay, the multiplicity, and the study design with its characteristic biases. Surveying that space is a computation over a graph that no single paper contains.
Imagine an effect that holds across the analyses of rule one and across independent cohorts. The engine checks it against each explanation the literature offers: a known pathway, a batch artefact, a confounder that some studies adjusted for and others did not, a genetic variant acting through a second route. Each explanation that fails is marked with the capsules that contradict it. Three outcomes are possible. A single explanation may survive, and then the engine has assembled a hypothesis that no paper states. Several may survive, and then the engine shows where their predictions differ. Or none may survive. That case first sends the engine back to check the effect itself, the extraction and the assumptions the studies share, because a contradiction is more often an error than a discovery. If the effect still stands, the engine has located something valuable: a robust effect that nothing in the record explains. Where the remaining explanations predict different results, the engine proposes the experiment that would separate them, and where they do not, it names the measurement that is missing. The list of explanations is the one the literature offers, and nobody can know that it is complete, so what the engine hands over is a proposal. This is the triangulation of the fifth essay run as a search.
The method has a name and a history. In 1964 John Platt called it strong inference: devise alternative hypotheses, devise a crucial experiment whose possible outcomes will, as nearly as possible, exclude one or more of them, carry it out so as to get a clean result, and repeat the procedure on what remains. He traced it to Francis Bacon and to T. C. Chamberlin's method of multiple hypotheses, and he credited it, on the strength of examples and argument, with the pace of molecular biology and high-energy physics [10]. His test for any piece of work was a question: what hypothesis does your experiment disprove? The engine puts that question to a whole literature at once.
This is new in a modest sense, and we think the modest sense is the useful one. The finding is a gap with exact edges, and every step that led to it is a check a person can open. It is also where the engine hands over. The causal hierarchy theorem says why: outside exceptional cases, what has been observed does not by itself fix what an intervention would do, and computing an effect from observations takes additional causal assumptions [11]. The engine states those assumptions with each answer, and it marks where an experiment would settle what they leave open.
Human judgment steers the search
The engine improves with use because use carries judgment. Which questions scientists ask, which answers they open, which ones they challenge and which they rank highly are all signals about where the field's attention is, and where it is not. Such signals help to direct attention. In a study of 17.9 million papers, those whose reference lists were mostly conventional combinations with a small share of unusual ones were nearly twice as likely to be highly cited, which is a measure of impact [12]. Sourati and Evans built this into a discovery model. To the text of the literature they added a record of who had written about what, and the model then predicted later discoveries about twice as precisely as the text-only method for energy materials, and 43% more precisely for drug repurposing. It could also be tuned to look where scientists were not looking, and the candidates it proposed there were evaluated in theory, without experiments [13]. Direct evidence that people's ratings can steer a generator is recent. When 110 research group leaders rated ideas that a system had generated for each of them, they gave 36.7% of the 4,451 ratings the lowest mark for interest. Ranking new ideas by the ratings collected so far roughly doubled the share of interesting ones among the top five, to 49% [14]. In another study, on language research, blinded reviewers rated a model's research ideas as more novel than those of human researchers, although the model produced few distinct ideas: about 200 non-duplicates among 4,000 [15]. Interest, impact and novelty are not correctness, and that is what the scoring record is for.
So the engine has two modes, and the scientist chooses between them. One follows the field, combining what is conventional with a little that is unusual. The other looks for combinations that nobody is positioned to try. In both, a person's ranking decides what is explored next, and the second shelf is where that exploration is recorded.
Showing the working
The ranking in the first section arrives without a derivation, and that is its weakness. An answer from the engine arrives as its derivation: the capsules it rests on, the condition each one contributes, and the rung at which each step was taken. The scientist opens these on the Nexitia canvas, and the check is theirs. A proposal whose working cannot be followed does not reach the scientist as a proposal at all.
Published work shows why this step matters, because in each case a person had to understand before the result counted. In knot theory and in representation theory, a machine-learning model pointed mathematicians to a pattern, and the mathematicians proved a theorem in each field; a further conjecture in representation theory remains open [16]. A critic argued that conventional statistics would probably have found the knot result, though not the other one [17]. That criticism is itself a useful lesson: the value lay in directing attention, and the proof stayed with people. Schut and colleagues extracted concepts from the AlphaZero chess program and taught them through example puzzles to four grandmasters. On unseen puzzles from the same concepts, all four solved more than before: one solved five more out of twelve, and another only one more. The authors call it a proof of concept [18]. In biology, Google's Co-Scientist proposed drugs to repurpose against acute myeloid leukaemia. In the authors' own cell-culture tests, three of five candidates that experts had chosen reduced the viability of leukaemia cell lines, and one of three that the system chose alone was clearly active. The authors call the validation preliminary [19].
We have built the human step into the design, and we do not leave it to chance. A scientist who can open a proposal, disagree with one capsule's reading and see the proposal change is doing the same check that a reviewer does, with the working in front of them.
Keeping score
A proposal earns its place by making a consequential question testable, and its value shows when the test comes back. Because the database is versioned and timestamped, each proposal can be logged before its outcome exists, with the capsule versions, the model and the retrieval settings it rested on. Each logged probability names an outcome, a population and a time horizon. Outcomes then arrive in the same database as ordinary records: a new study with a result, a replication, a correction, a retraction. Over time the log becomes a scoring record. It shows calibration, so that of the proposals given a seventy per cent chance, about seventy per cent came true. It also compares the forecasts with what the base rate alone would have scored. Forecasters have an exact standard for such a record. A scoring rule is proper if a forecaster does best, on average, by reporting what they actually believe, and the Brier score and the logarithmic score are strictly proper in that sense. The same work states the goal we adopt, which is to make forecasts as sharp as possible subject to their being calibrated [20]. A record that only ever repeats the base rate is calibrated, and it tells a scientist little.
Forecasting in science can be measured, and the published attempts show both that it works and how modest it still is. In one study, a prediction market of researchers called 29 of 41 psychology replications correctly, where a rule of always predicting failure would have scored 25 [21]. In a later set of 21 social-science experiments, the market's beliefs ranked the findings much as the replications did, with a rank correlation of 0.84 [22]. A model that read only the text of 96 psychology papers classified 68% of them correctly, against 61% for always predicting failure [23]. And among drug programmes already in clinical trials, those whose target had human genetic support for the disease were 2.6 times as likely to go from phase I to launch [24], after an earlier estimate of about double [25]. Those studies tie outcomes to features of the evidence. The capsule database records such features by construction, and it records the outcomes as they come. Swanson already separated the two cases a score must keep apart: a prediction made before the finding existed, and a retrodiction of a report that was already in print [1].
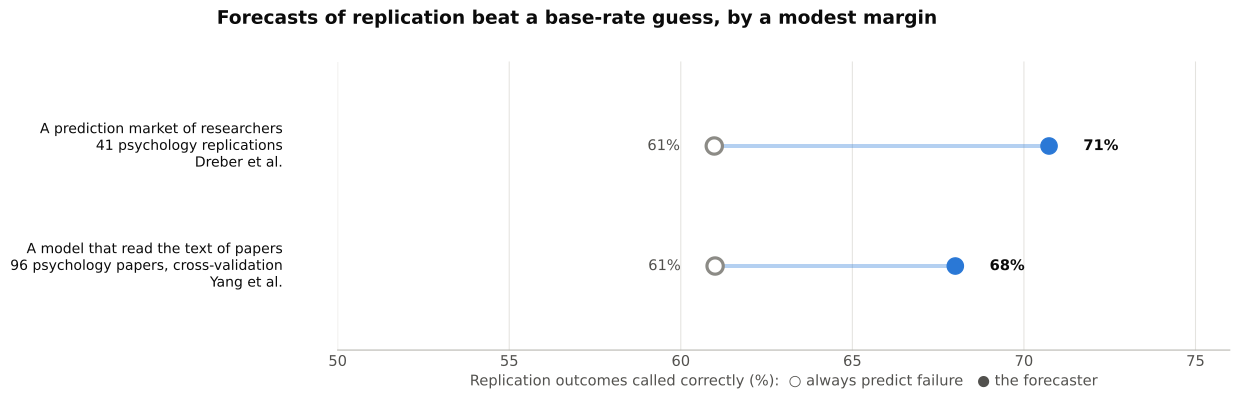
Filled dots are the forecasters, hollow dots the rule of always predicting failure. The two studies use different papers, so the rows are not compared with each other. Sources: references [21] and [23].
A record that updates with every new study also has to control how often it cries discovery. One published method does this for randomized trials. Under its assumptions, it controls the chance that the accumulating evidence, expressed as an e-value, ever crosses the discovery threshold when there is no effect, however often the analysis is updated [26]. An engine that follows many questions at once needs a multiplicity rule on top of that, which is the third rung again.
Three things can go wrong, and the design answers each. Labels can be biased, because only some claims are ever tested, replicated or retracted. The score therefore uses only proposals made before the outcome and describes performance among the proposals that were tested. It reports how many were tested and how they came to be chosen, so that a reader sees the selection. Later knowledge can leak into a forecast, as a retraction status would. Every forecast records its evidence cutoff, and a retrospective evaluation is checked separately for information that arrived later. And authors may write to the checks once they know which checks raise a score. Where raw files exist, the capsule checks use them and recompute the statistics; a claim taken from prose stays linked to its source, and a missing input stays marked as missing. A score attaches to a claim and never to a person.
What stays with the scientist
Proposals concern published claims, and only an experiment touches the world. As we noted in the fifth essay, the bottleneck in an age of abundance is digestion, because results arrive faster than people can verify, explain and absorb them. A compiled literature that answers with a whole family of analyses, shows its working and keeps score serves that bottleneck directly, and it does not remove it. The scientist still chooses which question matters, judges whether a proposal is plausible, and turns a verified result into an explanation that others can test.
We expect the scoring record to change how scientists work with such a database, much as a calibrated instrument changes how they work with a measurement. A literature that reports how often it has been right is one a scientist can use the way they use an instrument: not because it is always correct, but because it says how often it is.
References
- Swanson DR (1990). Medical literature as a potential source of new knowledge. Bulletin of the Medical Library Association 78(1): 29–37. https://pmc.ncbi.nlm.nih.gov/articles/PMC225324/. Reviews three pairs of literatures that are logically linked and do not cite each other. For fish oil and Raynaud's syndrome, 25 and 34 articles had no articles or authors in common, and a 32-patient randomized trial reported two years later supported the inference; the author calls the method neither a recipe nor an algorithm.
- DiGiacomo RA, Kremer JM, Shah DM (1989). Fish-oil dietary supplementation in patients with Raynaud's phenomenon: a double-blind, controlled, prospective study. The American Journal of Medicine 86(2): 158–164. doi:10.1016/0002-9343(89)90261-1. Thirty-two patients received fish oil or olive oil. In primary Raynaud's, 5 of 11 on fish oil and 1 of 9 on olive oil could no longer have an attack induced by cold; no benefit was found in secondary Raynaud's.
- Tshitoyan V, Dagdelen J, Weston L, Dunn A, Rong Z, Kononova O, Persson KA, Ceder G, Jain A (2019). Unsupervised word embeddings capture latent knowledge from materials science literature. Nature 571(7763): 95–98. doi:10.1038/s41586-019-1335-8. Word vectors trained on about 3.3 million abstracts ranked candidate thermoelectrics. Rebuilt from abstracts before 2009, three of the top five were later reported or suggested as thermoelectrics and two were never studied; across 83 materials the ranking's rank correlation with measured performance was 0.59 and 0.52.
- Ioannidis JPA (2005). Why most published research findings are false. PLoS Medicine 2(8): e124. doi:10.1371/journal.pmed.0020124. A model in which the probability that a statistically significant finding is true depends on the prior odds, the power, a bias term and the number of teams; the author argues that flexibility in designs and analyses raises the bias. The numbers in its examples are assumptions, not measurements.
- Stefan AM, Schönbrodt FD (2023). Big little lies: a compendium and simulation of p-hacking strategies. Royal Society Open Science 10(2): 220346. doi:10.1098/rsos.220346. Simulations with no true effect at the 5% level: about 40% false positives when the best of 10 uncorrelated outcomes is reported, almost 30% with 12 outlier rules, and about 7.5% to 10% for milder strategies.
- Steegen S, Tuerlinckx F, Gelman A, Vanpaemel W (2016). Increasing transparency through a multiverse analysis. Perspectives on Psychological Science 11(5): 702–712. doi:10.1177/1745691616658637. Runs every reasonable combination of data-processing choices. For one published study, 120 analyses gave 7 significant results where the original reported p = 0.012; the authors call their set of choices only a subset.
- Simonsohn U, Simmons JP, Nelson LD (2020). Specification curve analysis. Nature Human Behaviour 4(11): 1208–1214. doi:10.1038/s41562-020-0912-z. Estimates from all reasonable specifications are shown together and tested jointly against reshuffled data: 37 of 1,728 significant in one example (joint p = 0.85), and 85 of 90 in another (p < 0.002).
- Greenberg SA (2009). How citation distortions create unfounded authority: analysis of a citation network. BMJ 339: b2680. doi:10.1136/bmj.b2680. In a network of 242 papers and 675 citations around one claim, 94% of the 214 citations to the ten primary-data papers went to the four that supported the claim; the study classifies citations and does not test whether the claim is true.
- Shumailov I, Shumaylov Z, Zhao Y, Papernot N, Anderson R, Gal Y (2024). AI models collapse when trained on recursively generated data. Nature 631(8022): 755–759. doi:10.1038/s41586-024-07566-y. A language model fine-tuned over generations on the previous generation's output loses the tails of the original distribution first; keeping 10% of the original data at each step left only minor degradation. The result concerns training, not the storage of generated text.
- Platt JR (1964). Strong inference. Science 146(3642): 347–353. doi:10.1126/science.146.3642.347. An address arguing that fields advance fastest when they devise alternative hypotheses and crucial experiments that exclude some of them, then refine what remains; it credits Bacon and Chamberlin and argues from examples in molecular biology and high-energy physics, with no measured evidence.
- Bareinboim E, Correa JD, Ibeling D, Icard T (2022). On Pearl's hierarchy and the foundations of causal inference. In Probabilistic and Causal Inference: The Works of Judea Pearl, ACM Books, pp. 507–556. doi:10.1145/3501714.3501743. Proves that the three layers of the causal hierarchy (observing, intervening, imagining counterfactuals) almost never collapse into one another, so observational data need an assumed causal diagram before an interventional effect can be computed; the authors add that this is not a general impossibility result.
- Uzzi B, Mukherjee S, Stringer M, Jones B (2013). Atypical combinations and scientific impact. Science 342(6157): 468–472. doi:10.1126/science.1240474. Among 17.9 million papers, those combining high conventionality with a tail of novel pairings of cited journals were highly cited 9.11 times per 100, against a background of 5 per 100, in papers from 1990 to 2000; an association with citations.
- Sourati J, Evans JA (2023). Accelerating science with human-aware artificial intelligence. Nature Human Behaviour 7(10): 1682–1696. doi:10.1038/s41562-023-01648-z. Adding who has written about what to the text raised the precision of predicted discoveries over a text-only baseline, by about 100% for energy materials and 43% for drug repurposing. Candidates chosen to avoid where scientists cluster were judged by theory-based scores only.
- Gu X, Krenn M (2026). Generating interesting scientific ideas using knowledge graphs and LLMs: evaluations with 100 research group leaders. Proceedings of the National Academy of Sciences 123(46): e2611349123. doi:10.1073/pnas.2611349123. Of 4,451 ratings by 110 group leaders of ideas personalised to them, 36.7% were the lowest mark for interest and 24.9% were 4 or 5 out of 5; ranking by collected ratings gave 49% precision in the top five against a base rate of about 25%. The ratings measure personal interest, not correctness.
- Si C, Yang D, Hashimoto T (2024). Can LLMs generate novel research ideas? A large-scale human study with 100+ NLP researchers. ICLR 2025. arXiv:2409.04109. Blinded reviewers scored model-generated ideas higher on novelty than ideas by human researchers (5.64 against 4.84), on prompting topics in language research only; about 200 of 4,000 generated ideas per topic were non-duplicates.
- Davies A, Veličković P, Buesing L, Blackwell S, Zheng D, Tomašev N, Tanburn R, Battaglia P, Blundell C, Juhász A, Lackenby M, Williamson G, Hassabis D, Kohli P (2021). Advancing mathematics by guiding human intuition with AI. Nature 600(7887): 70–74. doi:10.1038/s41586-021-04086-x. A model's attributions pointed mathematicians to a relationship in knot theory and to one in representation theory; they proved a theorem in each, and a further conjecture in representation theory remains open.
- Davis E (2021). Deep learning and mathematical intuition: a review of (Davies et al. 2021). Preprint. arXiv:2112.04324. Argues that conventional statistics would probably have sufficed for the knot result, and that the representation-theory result did need the deep-learning model.
- Schut L, Tomašev N, McGrath T, Hassabis D, Paquet U, Kim B (2025). Bridging the human–AI knowledge gap through concept discovery and transfer in AlphaZero. Proceedings of the National Academy of Sciences 122(13): e2406675122. doi:10.1073/pnas.2406675122. Four grandmasters studied puzzles built from concepts extracted from AlphaZero; all four then solved more unseen puzzles from the same concepts, with gains from one puzzle to five of twelve. The authors call the study a proof of concept and name priming as a possible confounder.
- Gottweis J, Weng W-H, Daryin A, Tu T, et al. (2026). Accelerating scientific discovery with Co-Scientist. Nature 655(8122): 487–496. doi:10.1038/s41586-026-10644-y. For acute myeloid leukaemia, three of five expert-chosen repurposing candidates reduced the viability of cell lines, and one of three candidates from an autonomous run was clearly active; the authors call the validation preliminary.
- Gneiting T, Raftery AE (2007). Strictly proper scoring rules, prediction, and estimation. Journal of the American Statistical Association 102(477): 359–378. doi:10.1198/016214506000001437. Defines a scoring rule as proper when the expected score is maximised by reporting one's true belief, and strictly proper when only that report maximises it; the Brier and logarithmic scores are strictly proper, and the stated aim of forecasting is sharpness subject to calibration.
- Dreber A, Pfeiffer T, Almenberg J, Isaksson S, Wilson B, Chen Y, Nosek BA, Johannesson M (2015). Using prediction markets to estimate the reproducibility of scientific research. Proceedings of the National Academy of Sciences 112(50): 15343–15347. doi:10.1073/pnas.1516179112. Of 41 completed replications of psychology studies, 25 failed. A market of researchers called 29 of the 41 correctly; a survey of the same researchers before trading called 23 of 40.
- Camerer CF, Dreber A, Holzmeister F, Ho T-H, Huber J, Johannesson M, Kirchler M, Nave G, Nosek BA, Pfeiffer T, et al. (2018). Evaluating the replicability of social science experiments in Nature and Science between 2010 and 2015. Nature Human Behaviour 2: 637–644. doi:10.1038/s41562-018-0399-z. Of 21 experiments, 13 replicated. The rank correlation between beliefs and replication was 0.84 for the prediction market and 0.76 for the survey.
- Yang Y, Youyou W, Uzzi B (2020). Estimating the deep replicability of scientific findings using human and artificial intelligence. Proceedings of the National Academy of Sciences 117(20): 10762–10768. doi:10.1073/pnas.1909046117. A model trained on the text of 96 replicated psychology papers reached an accuracy of 0.68 in cross-validation, against 0.61 for always predicting failure, and 0.65 to 0.78 on 317 papers from other replication projects.
- Minikel EV, Painter JL, Dong CC, Nelson MR (2024). Refining the impact of genetic evidence on clinical success. Nature 629(8012): 624–629. doi:10.1038/s41586-024-07316-0. Among 29,476 target and indication pairs in clinical development, those with human genetic support were 2.6 times as likely to go from phase I to launch. The association is retrospective, and the authors note that it does not give the chance that a genetic finding becomes a drug.
- Nelson MR, Tipney H, Painter JL, et al. (2015). The support of human genetic evidence for approved drug indications. Nature Genetics 47(8): 856–860. doi:10.1038/ng.3314. The earlier estimate that selecting targets with genetic support could double the success rate in clinical development.
- ter Schure J, Grünwald P (2025). ALL-IN meta-analysis: breathing life into living systematic reviews and prospective meta-analyses. F1000Research 11: 549, version 2. With e-values, the chance that the running evidence ever crosses the threshold when no trial has an effect is at most the stated level, however often the analysis is updated; developed for randomized trials, with wider intervals than a conventional analysis.