Scientific Figure Master
Give it your raw data and your figure caption. Get the figure back.
Build the figure a researcher intends from raw data plus intent — a plain instruction or the manuscript caption you already wrote. The skill parses that intent into a figure spec (archetype, groups, series, error bars, statistical test, significance scheme, units, n), binds it to your columns, computes the statistics it annotates, renders at final print size in a venue-neutral style, and verifies the figure supports the claim. Also covers AI illustrations and code-first schematics.
$5.00 one-off
Preview — package delivery is not available yet
- Version
- 1.1.2
- Curated
- 2026-09-25
- Package
- 338 KiB unpacked
- License
- MIT
python3 with matplotlib, numpy, pandas, scipy, statsmodels and openpyxl
License and attribution corrected on 25 September 2026. Scientific demonstrations and native-agent checks retain their original dates and scope; no new independent human review is claimed.
Evidence
Caption in → figure out
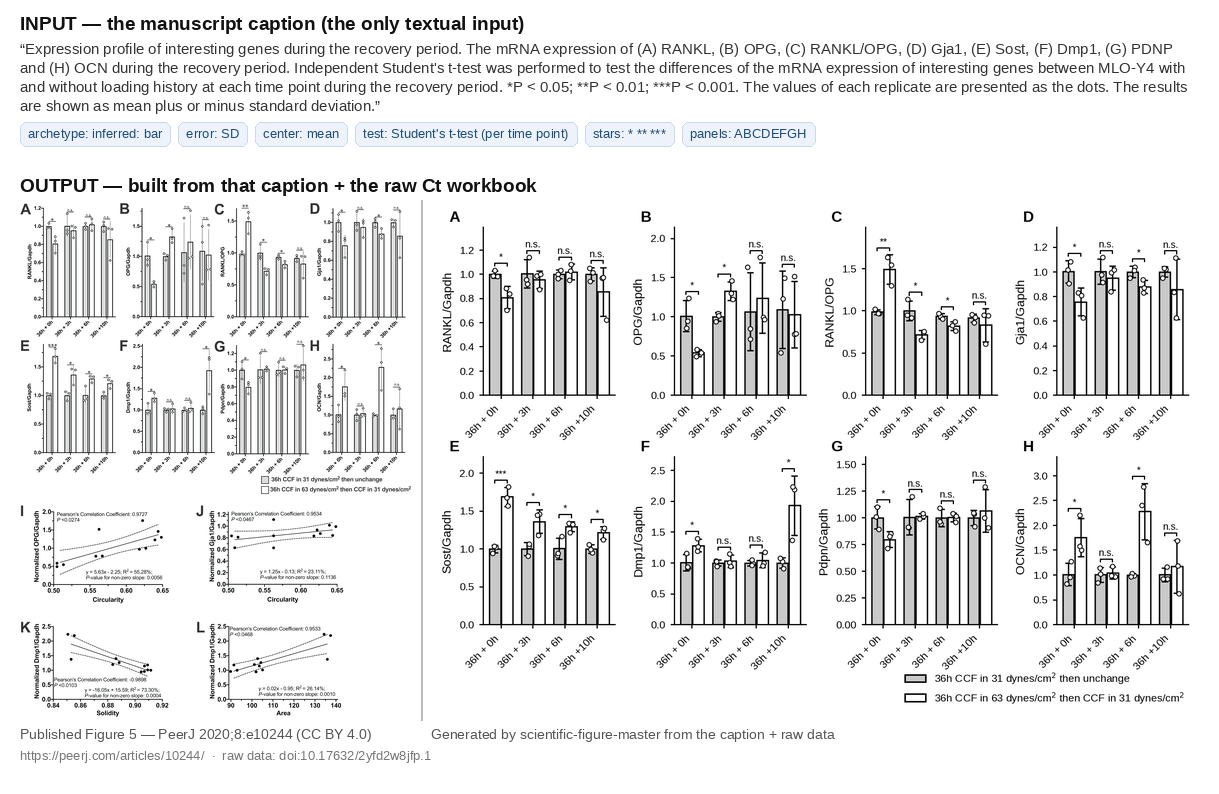
demonstrationThe only textual input is the paper's own caption; the data is the raw qPCR Ct workbook from its public deposit. From that one sentence the skill extracted the error bar (SD), the central statistic (mean), the test (Student's t-test at each time point), the star scheme (*<0.05, **<0.01, ***<0.001) and the eight panel letters — then computed ΔΔCt fold change per replicate, ran the tests, and rendered the figure.
The published panel is shown beside the generated one so you can judge the result yourself. All eight gene panels' bar heights and all 32 significance-star tiers agree with the published figure.
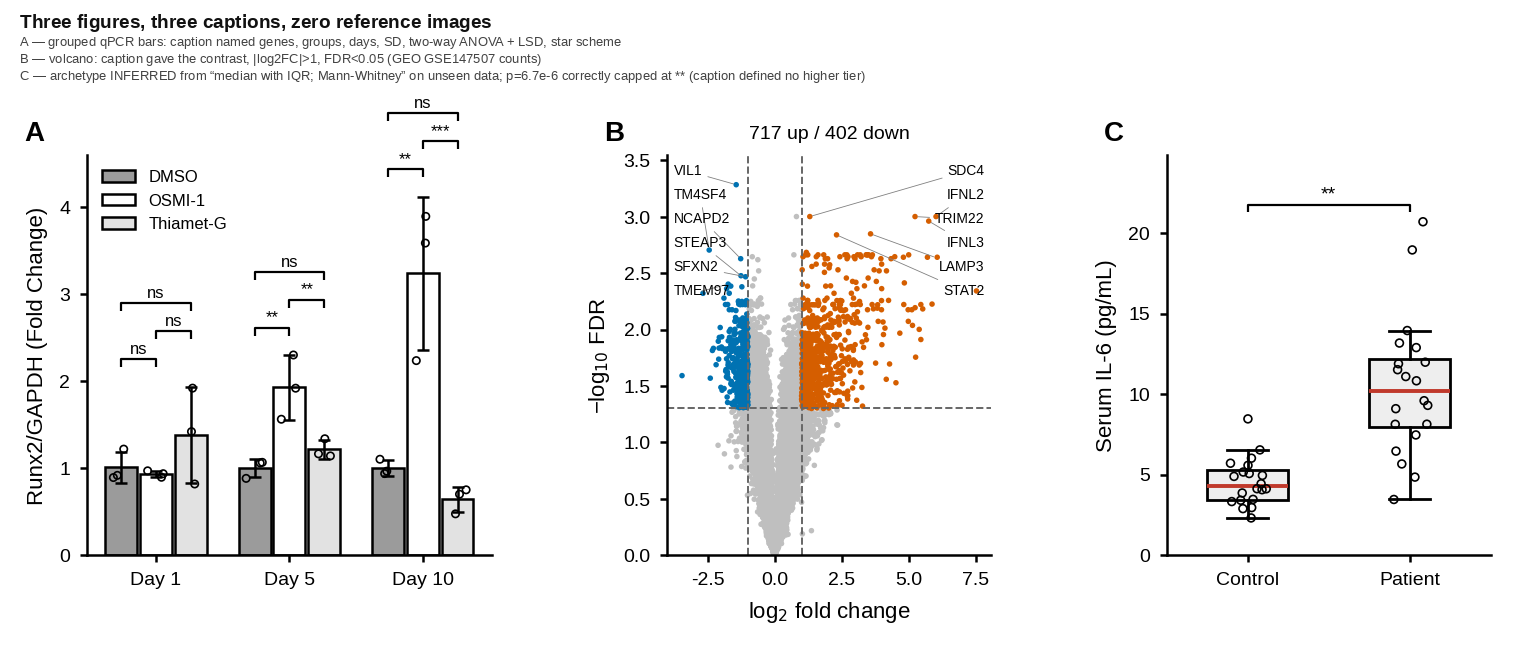
Three captions, three figures, zero reference images
demonstrationNothing but caption text drove these. A — grouped qPCR bars: the caption named genes, treatments, days, SD, two-way ANOVA with Fisher's LSD and the star scheme; the pipeline found the columns, computed per-day ΔΔCt and placed the brackets. B — volcano: the caption gave the contrast and thresholds (|log2FC| > 1, FDR < 0.05), built from a public count matrix.
C is the honest case. On data it had never seen, the caption never named a chart type — "median with interquartile range; Mann-Whitney U test" was enough to infer box plus individual points. The test returned p = 6.7 × 10⁻⁶, and the figure still shows two stars, because that caption defined no higher tier. The skill will not invent a four-star result.
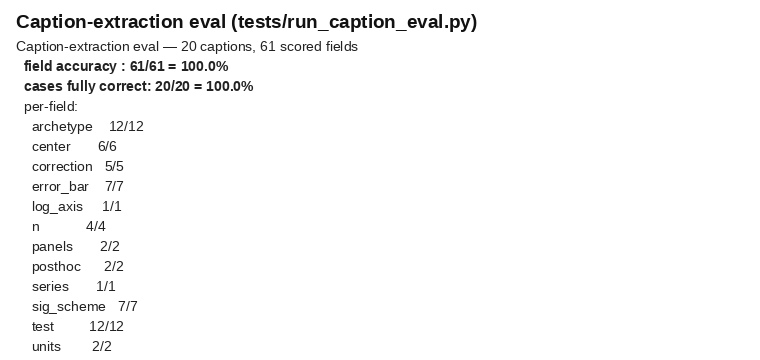
How reliably does it read a caption?
measuredCaption parsing is measured, not asserted. The bundled eval set holds 20 real captions — from the papers above, from eLife 2023;12:e83345 (CC BY 4.0), and from common clinical and omics caption idioms — scored on the fields a competent reader would call unambiguous.
Run it yourself after install with python3 tests/run_caption_eval.py. The set is also a regression guard in the unit suite, so a parser change that breaks a caption fails the build. Captions that genuinely under-specify (a bare figure title) are reported as unspecified fields rather than silently guessed.
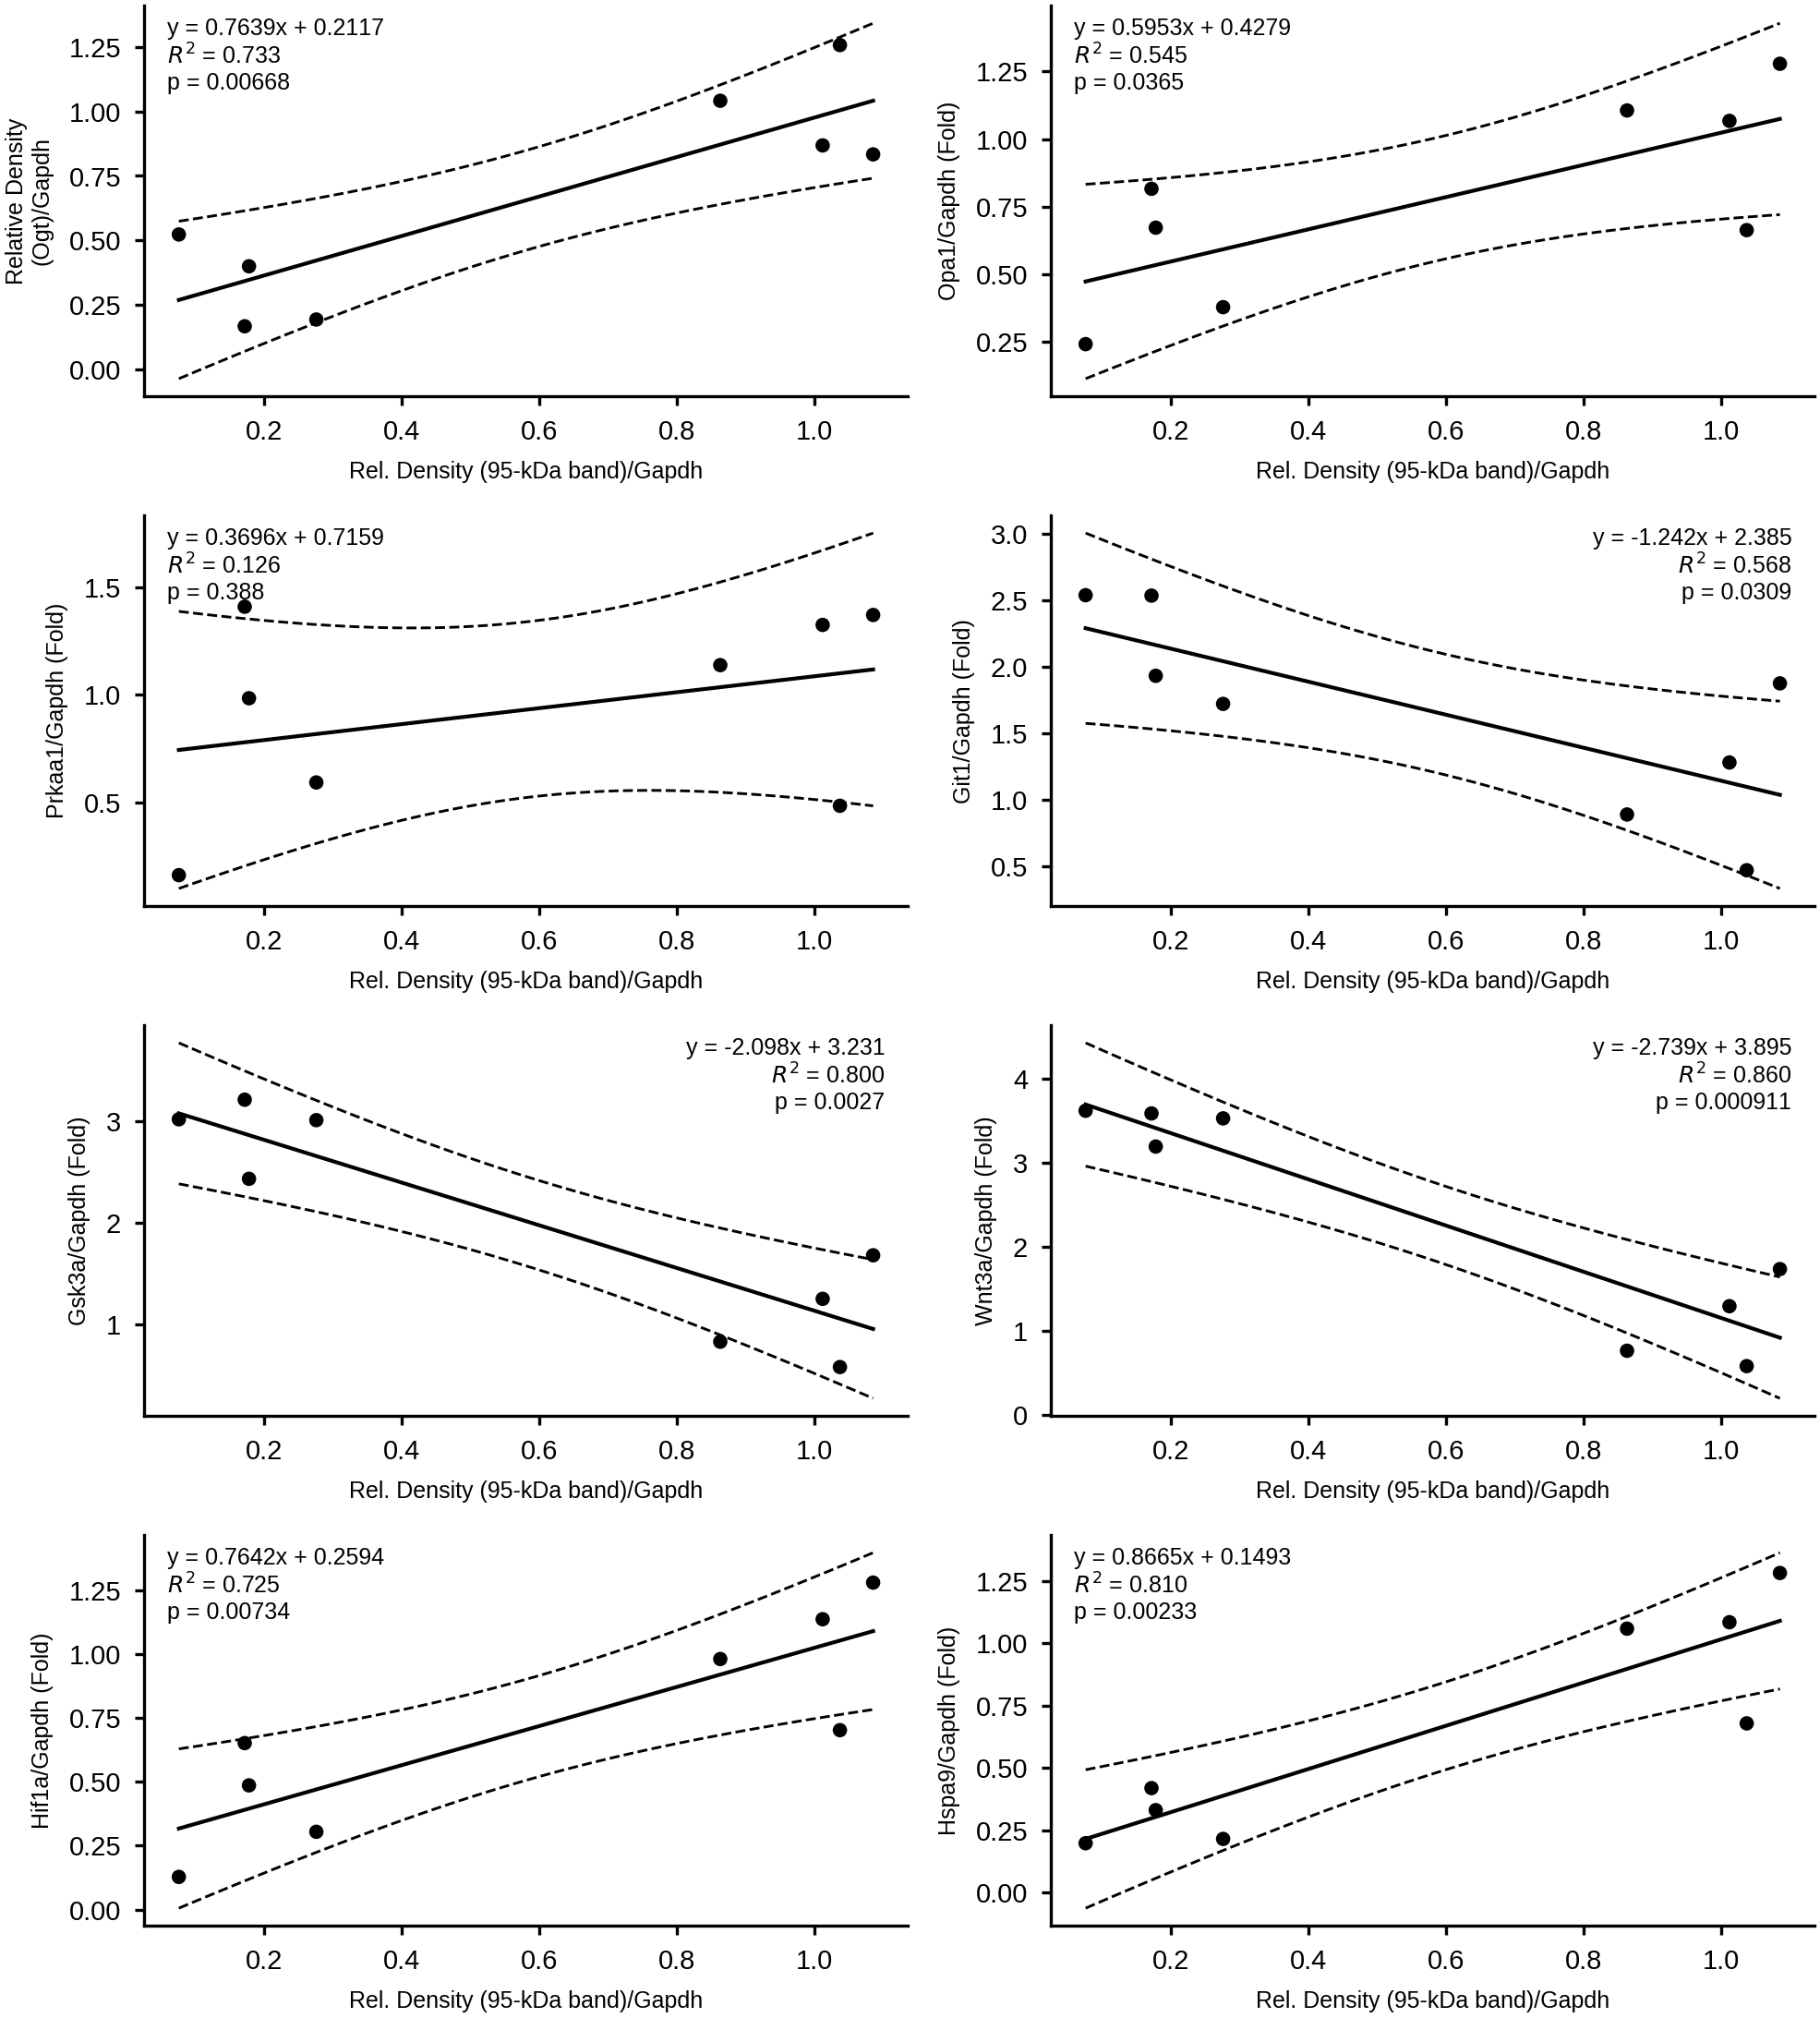
Figures whose numbers were checked against the literature
measuredBefore trusting a figure engine, check its arithmetic. Each panel below was rebuilt from public raw data and compared against the published values. BioFactors 2025;51:e2131 Figure 6E — all eight regression panels reproduce every printed digit: slope, intercept, R² and Wald p (for example Ogt: y = 0.7639x + 0.2117, R² = 73.28%, p = 0.0067).
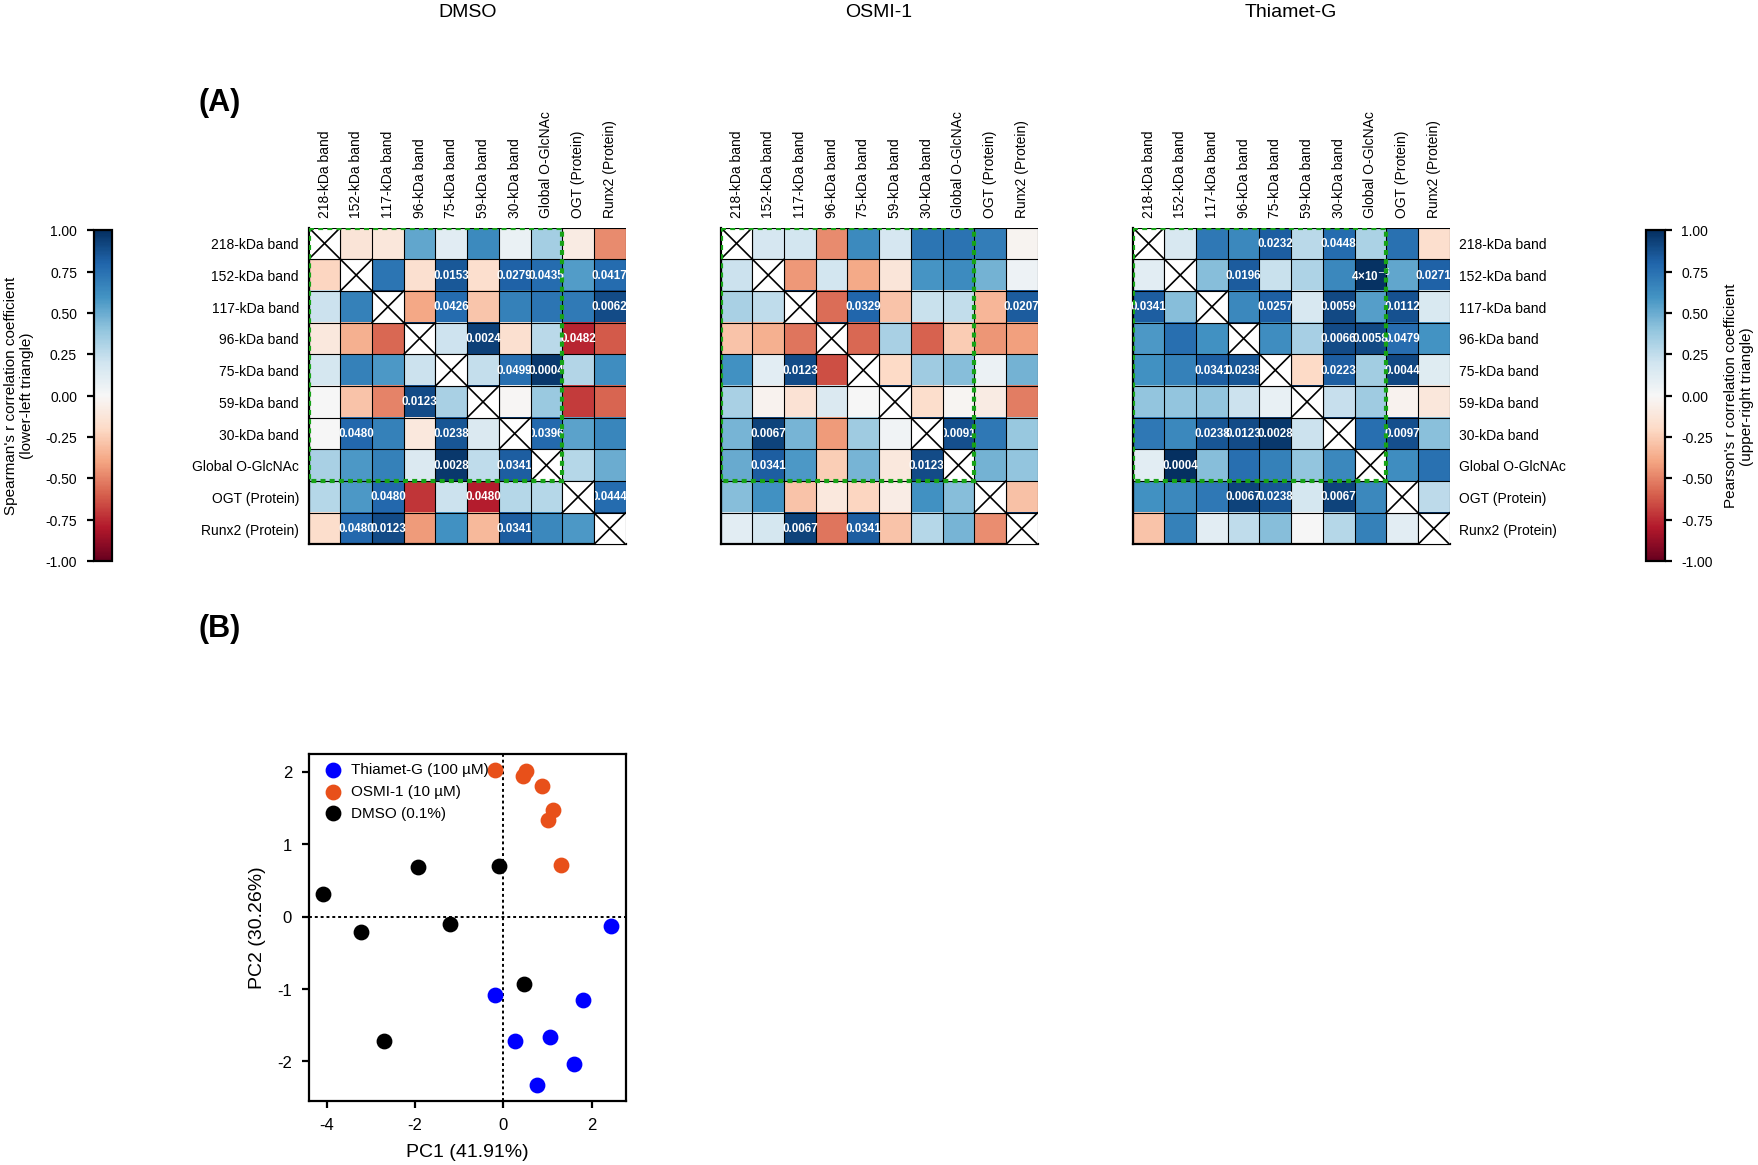
BioFactors 2021;47:992 Figure 1A — the recomputed viability ANOVA lands exactly on the published p = 0.0003, F = 6.504; Figure 3's split Spearman/Pearson heatmaps reproduce every readable published p-value to four decimals using exact-permutation Spearman, and its PCA reads PC1 41.91% / PC2 30.26%. PeerJ 2020;8:e10244 Figure 7 — the FRAP two-way-ANOVA variance decomposition matches (18.4/68.0/3.6 versus the published 18.52/67.78/3.72%).
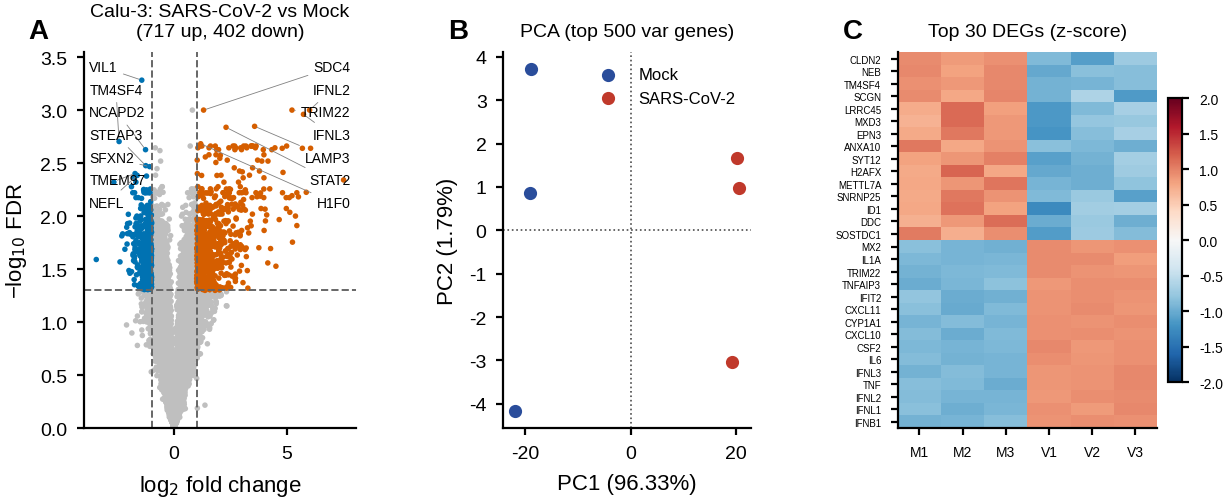
On an independent dataset it had never seen, the bioinformatics path recovers the published SARS-CoV-2 Calu-3 interferon signature from raw counts (IFIT2, IFNL1-3, CXCL10, TNF, IL6; PC1 separates the groups at 96.3%). Wiley figures are linked rather than embedded — open them beside the generated panels shown here.
22 archetypes, venue-neutral by default
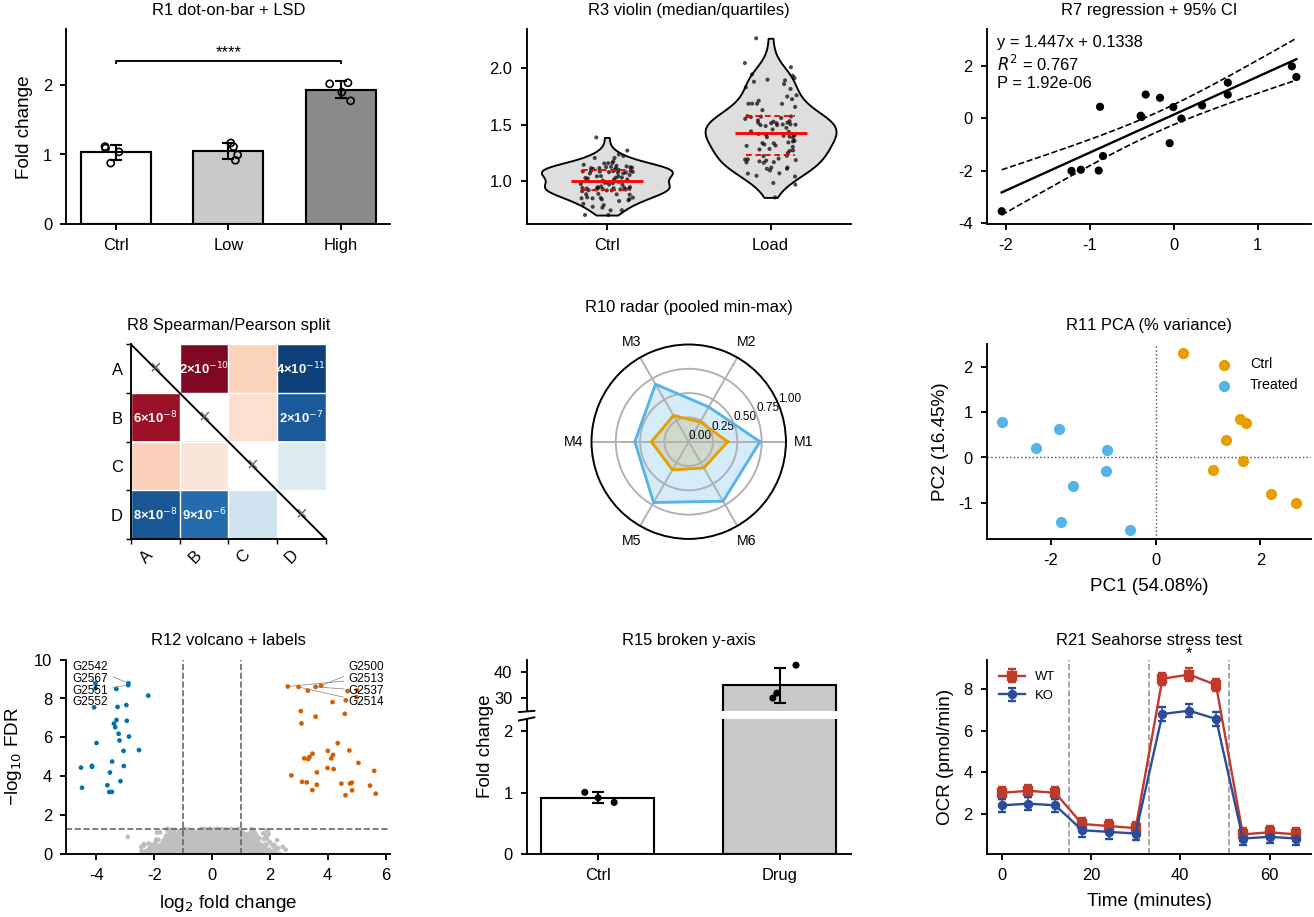
demonstrationThe bundled examples/gallery.py renders nine core archetypes offline in seconds — your install self-check. The catalogue covers 22: dot-on-bar and dot-strip with LSD/FDR brackets, grouped two-factor bars with a two-way-ANOVA interaction p, box and violin, replicated and single-series time courses, right-axis-FDR series, regression with 95% CI, split correlation heatmaps with exact p-values, clustered heatmaps, radar profiles, PCA, volcano with decluttered gene labels, enrichment dot plots, survival, forest, broken axes, blot montage with densitometry, qPCR ΔΔCt, kinetic model fits and Seahorse OCR/ECAR stress tests.
Style is a parameter, not an opinion: the default is a neutral publication look that every journal accepts, while prism (the GraphPad dialect) and nature are opt-in presets chosen from your target venue. Column widths for Nature, Science, Cell, PLOS, IEEE and Elsevier are built in.
What it refuses to do
measuredNo decorative statistics: every star comes from a named, re-run test, and the caption's own legend defines the vocabulary — the skill never invents a tier the caption does not define. No AI-drawn data: numbers are always plotted by code, and image models are reserved for illustrations and schematics.
It contradicts the caption when the data does. If a caption claims a significant increase and the test returns p = 0.2, the output says so instead of drawing a star. Fields a caption leaves unstated are reported as unspecified, filled explicitly and surfaced — not buried. And where a public deposit disagrees with its own paper (post-publication revisions), both values are reported rather than one being tuned to match.
What's in the package
23 files · 338 KiB unpacked · standard Agent Skills layout
Requirements
- python3 with matplotlib, numpy, pandas, scipy, statsmodels and openpyxl
- The bundled plotting/statistics scripts can run locally without API keys. AI interpretation or illustration uses the configured host and provider; review those data paths before supplying unpublished material
- Optional: Rscript, only for deposits that ship .RData analysis checkpoints
- GraphPad Prism is not required; its visual dialect is an optional style preset
Install — by agent
Package delivery is not available yet. These instructions describe installation once you have the ZIP. The compatibility table records the actual test date, environment and scope for each agent.
Install for your agent
Installation overview. Follow the steps for your agent and check the compatibility table for the tested scope.
- 1.
Download the package
Checkout and package delivery are not available yet. These are installation instructions for a future downloaded ZIP.
Preview — package delivery is not available yet
The steps below describe installation once you have the ZIP. Checkout and downloads are not enabled.
- 2.
Unzip into a skills directory
Personal scope shown; use <project>/.claude/skills/ for project scope. Claude.ai (web) accepts the zip directly under Settings → Skills, but cannot run the bundled Python tooling.
bashmkdir -p ~/.claude/skills/scientific-figure-master unzip scientific-figure-master-1.1.2.zip -d ~/.claude/skills/scientific-figure-master - 3.
Self-check
A new session discovers the skill automatically from its SKILL.md description.
bashclaude -p "Do you have the scientific-figure-master skill available? State its name and what it does."
Agent compatibility
| Agent | Status | Method | Notes |
|---|---|---|---|
| Claude Code 2.1.209 | Verified2026-08-12 | Native discovery from ~/.claude/skills / <project>/.claude/skills | Developed, validated and curated in Claude Code; 32/32 unit tests and 61/61 caption-eval fields pass on this bench. |
| AROS-core 7.9.1 (checked build; Core is now 7.13.0) | Verified2026-08-12 | ~/.gemini/skills surfaced by the AROS layer | Registered in the brain skill index (embedding-indexed); supersedes the three legacy figure skills, which now carry pointers to it. |
| Codex CLI — | Untested | Native discovery from ~/.codex/skills | Pure-Python package with a standard Agent Skills layout; not yet run on our bench for this skill. |
| claude.ai (web) — | Untested | Zip upload under Settings → Skills | The package matches the upload format, but the web sandbox cannot run the bundled Python tooling. |
License and reuse
MIT permits commercial use, modification, redistribution and resale with notices retained. Includes K-Dense and Haojae attributions. The earlier commercial storefront label was inconsistent with the source.
The displayed price does not change the license. Terms apply to the identified edition; earlier grants and third-party rights are preserved.
Provenance & integrity
Emerged in AROS-core on 2026-08-12 by merging three in-brain figure skills (data_visualization, scientific-illustration-generator, scientific-schematics) and hardening the result over three adversarial rounds: figures rebuilt from public raw data for three peer-reviewed papers, an independent GEO dataset, figure-convention audits of eLife open-access papers, and a 20-caption extraction eval. v1.1.0 refactored it from a reproduction tool into an intent-driven engine — venue specifics became style presets and the reproduction log moved to references/validation_evidence.md as evidence rather than doctrine. Workflow patterns adapted from scipilot-figure-skill (MIT © Haojae); journal constants from scientific-visualization (MIT © K-Dense Inc.).
SHA-256 of scientific-figure-master-1.1.2.zip — verify your download against this hash:
b5378310f385929f3c47f90be0b82f264550dbf6210a0fcd27f0342308bd7ffc